download: pdf-version
On July 1st 2020, an article titled "Abrupt increase in harvested forest area over Europe after 2015" [1] was published in the scientific journal Nature. In the article, a group of researchers from the EU Joint Research Center (JRC) claimed that the harvested forest area in Europe increased by 49 percent with a corresponding biomass loss of 69 percent during the period 2016–2018 compared to 2011–2015. The article has sparked considerable controversy and received substantial negative responses from forest experts across Europe, identifying serious deficiencies in the applied methodology and the drawn conclusions. Representing the major forest monitoring programs, we, the European National Forest Inventories Network, feel the urgent need to counter some of its claims.
First and foremost we want to state that comprehensive field campaigns are the primary data source of all European NFIs, where detailed and reliable information is gathered on single tree level over time. Despite that, many NFIs also utilize remote sensing data from various platforms, such as high-resolution aerial imagery, 3D laser scanning, as well as optical and radar satellite data to a substantial extent. The integration of remote sensing data supports the field campaigns logistically but, more importantly, enables novel analytical possibilities and data products that are not feasible with field campaigns alone. However, it is important to remember that all land-cover related analysis based on remote sensing data needs strong support from ground surveys for the correct interpretation of the results. The satellite images and the products derived from them which were used for the JRC study are global products, intended to identify broad trends and patterns on a larger scale and not for a rather detailed analysis and comparison of countries with partly substantially different silvicultural traditions and biophysical conditions.
Concerning the criticized coarse temporal resolution of the NFI field campaigns, we decidedly respond that for most applications (like harvest statistics), a lag of a few years is not a problem in fields like forestry where development takes place over several years to even decades and the increased accuracy from better data is of higher importance. For the remaining cases where short-term information is required (like pest localisation, damage assessment after disturbances, etc.), satellite images with a high temporal resolution are used by NFIs as well [2, 3].
The Nature article refers to the used satellite images as "fine-scale" and "high-resolution", yet they are composed of 30x30m pixels which have been proven to be too coarse for several applications in forestry.
In addition to the inferior data basis, we also notice several methodological shortcomings and/or non-transparencies:
- The authors claim that all analysed data is made available in an online repository, yet the data contained in the repository are only the values needed to create the figures and can't be verified and reconstructed like this.
- The article never explains how salvage loggings are distinguished from regular harvest.
- The article states that major windfalls are factored out from the analyses, yet their effects appear and are discussed in the analyses. It is unclear which approach has been chosen.
- Some major windfalls are factored out according to a formula presented in the article. There is no validation of this approach. We do not know how much is missed and how much is falsely classified as major windfall.
- The quality of the estimation is assessed via correlations of normalised values. There are several problems with that:
a) The authors compare harvested timber volume of the countries' reports to detected harvested forest area which is not quite the same. There can be substantial variations in volume per hectare and the link between harvested area and harvested volume is rather loose.
b) The normalisation can critically shift the values if there are large outliers because the largest value is used for the normalisatoin. This has likely happened for example in Belgium, France, and Slovakia, where most values are a lot smaller than 1, see Figure 1 below.
c) A correlation alone is not enough. The values need to be of the same magnitude as well and that is very rarely achieved, see Figure 1 below. Often the trend lines are more or less parallel but are distant from each other.
d) A correlation of 0.6 is considered high in this article. This is highly debatable.
e) When assessing the correlations, a high correlation misleads the authors to see a trend confirmed. The calculation of the correlation does not take the temporal succession into account. Germany shows a correlation of 0.56, yet there are opposing trends (determined with linear regression, see Figure 1) according to Global Forest Change (GFC) maps and the national data. The same situation is in Luxembourg with a correlation of 0.49.
- Sweden - which is one of the main drivers of the results - has a slightly negative correlation. It does not seem to make the authors question their results. The presented explanations as to why the mismatch should be of no concern are overly optimistic.
- In Slovakia the correlation is 0.73 (the third highest), yet the value ranges are very different (country reports from 0.75 to 1 whereas the GFC values range from 0.15 to 1, see Figure 2).
- Generally, the interpretations of the country results are very optimistic regarding the performance of the GFC.
- A detected patch harvested area is classified as correct if at least 50% of it is confirmed by high resolution images. This is a very low threshold and makes the article's results seem more reliable than they are.
- The authors try to match the countries' forest area recognition by employing different tree cover thresholds and choose the one that results in the most similar area. This threshold often differs greatly from the one that the respective country uses. The comparability is questionable and contradicts the article claim that they provide “consistent monitoring of harvested forest areas across large geographical areas”
- The authors call harvested area "forest loss" but a harvest is only a loss of growing stock. A harvested corn field is not called a "loss of agricultural land" and there is no reason to treat forest land differently. It is even mentioned in the article that the use of the term "forest loss" is generally not used in this context, yet the authors decided to not employ the commonly used terms and instead chose a more drastic and misleading wording.
- The article does not take into account that the most recent years were extraordinarily dry, which causes wide-spread anomalies in the leaf area index (LAI) which is based on the NDVI (see Figure 3). LAI and NDVI are used to detect vegetation and thus anomalies likely pose a source of error.
- For biomass estimation, a very crude map with a resolution of 100x100m is used. This is combined with an estimate for harvested forest area which has a low correlation with the national reports as well as the described shortcomings. All in all this makes the estimate of a 69% increase of AGB harvest unreliable. In addition, it is unlikely that all forest types and age classes of Europe are equally well represented in the data that was used to train the AGB map. The reliability of the map is unkown.
- The authors "assigned an AGB value of zero to those pixels with forest loss". This leads to an over-estimation of harvested AGB because frequently some AGB remains.
- In the extended data section, the map that shows harvested areas was validated with high-resolution aerial images. The achieved classification accuracies (Extended Data Fig. 3) for small and medium sized patches are rather small and the effect on the results is unknown.
- In NFI reports, it is standard procedure to include a statistically rigorous uncertainty analysis. We cannot see that this was done here. The original map products, as well as the derived products are not error free and it is likely that the different sources interact with each other to some unknown extent. The conclusions are not drawn with the necessary precautions and despite that are stated as facts.
The article does not provide a distinct discussion and conclusion. It mentions "forest-based climate [change!] mitigation" several times and seems to conclude that a reduction of harvests is required in order to allow the EU member states to reach their goals for climate neutrality. Hereby, the article regards forests purely in their function as carbon storage and carbon sinks which is a grave misconception. If forests are used only as carbon sinks, their storage capacity will eventually be filled and they can no longer act as sinks [4]. That point has been well known for years and it is one reason why countries report not only the development of carbon storage and carbon sinks in forests in the international GHG monitoring but also the development of the carbon storage of wood products. But even more important than the forests' effect as carbon storage and sink are replacement effects (substitution), where the use of timber is more eco-friendly and less resource intensive than the use of fossil fuels, steel, concrete, etc. [5].
In the same issue, the editorial [6] refers to this article, drawing conclusions on a faulty basis. Harvest seems to be equated with burning and thus instant carbon emission ("large amounts of carbon are released quickly as older trees are felled"). Any other use of timber is ignored and a very one-sided view of forestry is adopted. Efficient future forestry policies will have to consider a multitude of aspects and tasks of forests, ranging from carbon sequestration to recreational spaces, timber provision, landscape protection, biodiversity, and more.
We find it disconcerting that none of the highly qualified institutions that carry out the NFIs in Europe and willingly share their expertise were contacted while this research was conducted. Several points of criticism voiced here could have been avoided easily. In particular for the single country evaluations, the local expertise would have been of great value.
Figures:
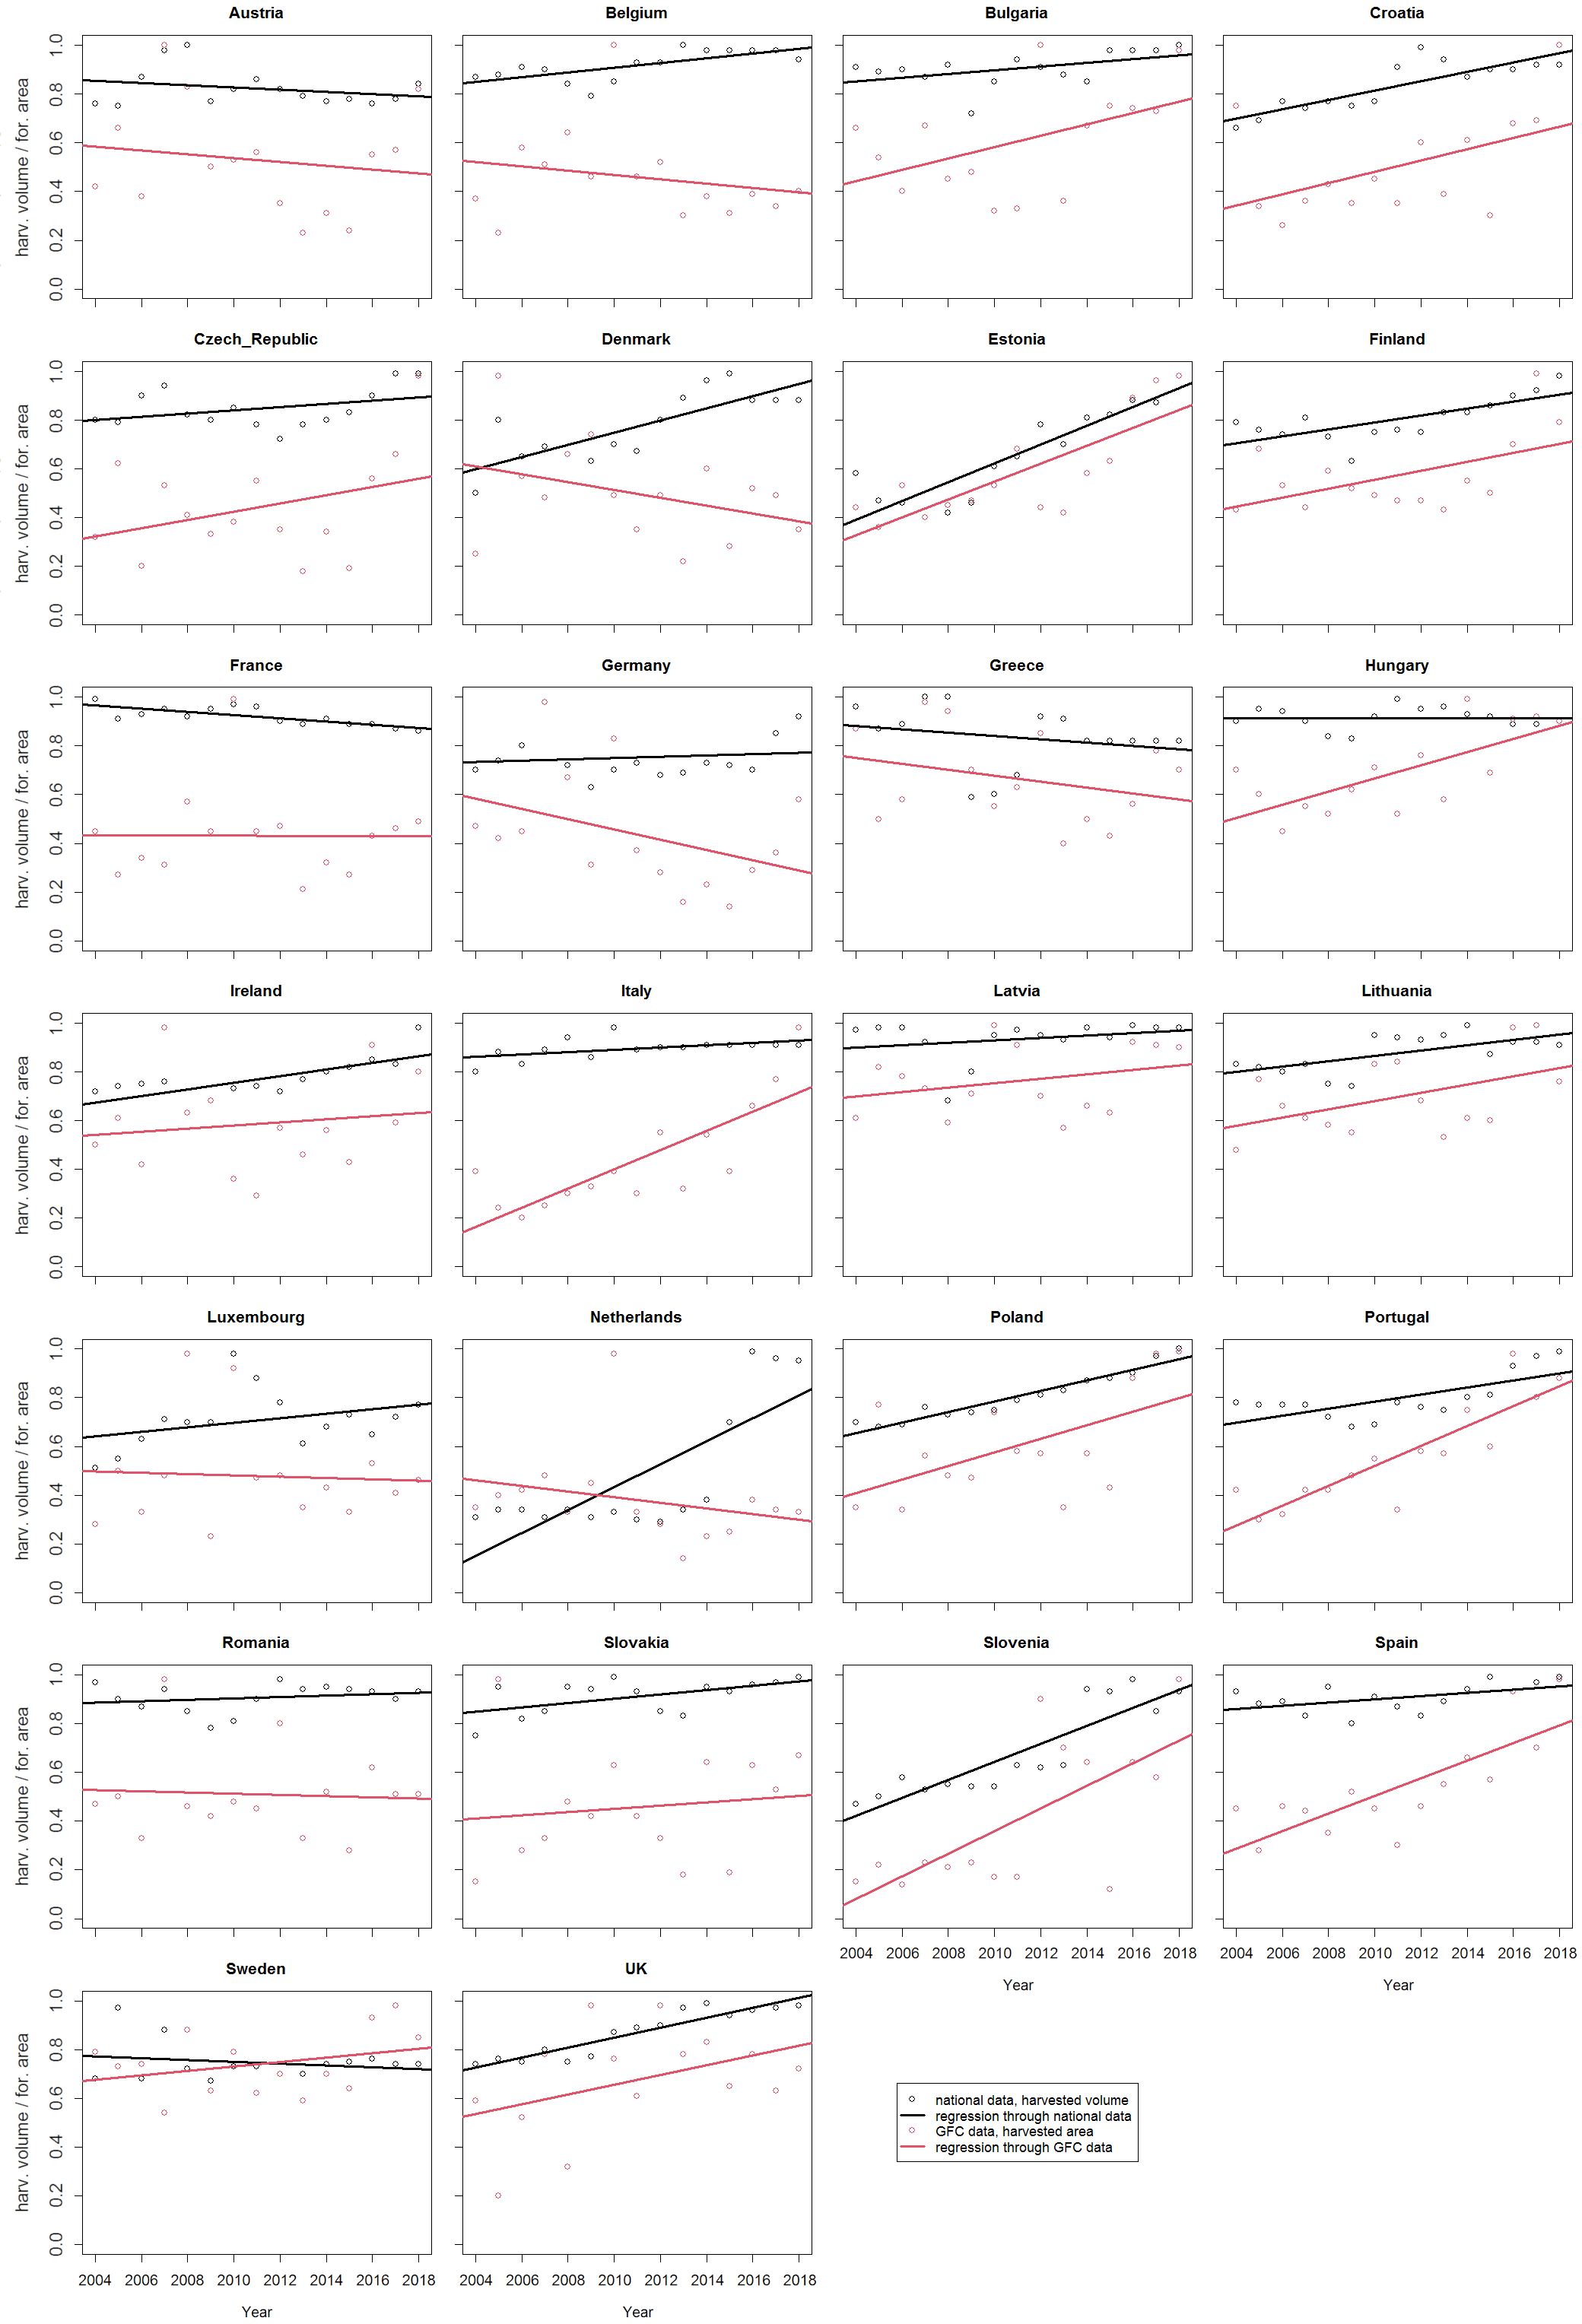
Figure 1: Normalised values of harvested forest area (red, from GFC maps) and harvest removals (black, from national statistics) extracted from Figure 6 in the article. Linear regression lines are estimated to visualise the trend. For example, Germany and Luxembourg show opposing trends despite having positive correlations.
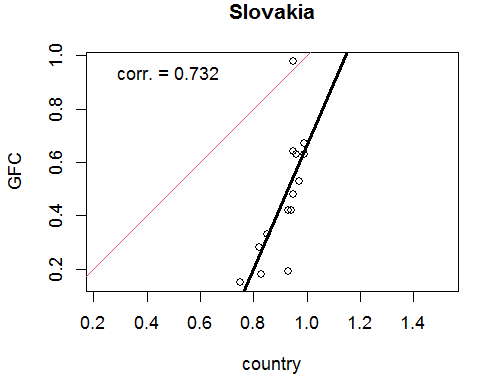
Figure 2: The normalised values of the country's harvested volume statistics and of the harvested area derived from GFC are plotted against each other. They are highly correlated but they are far from the identity line (red line). A linear regression line has been plotted through the data points (black line).
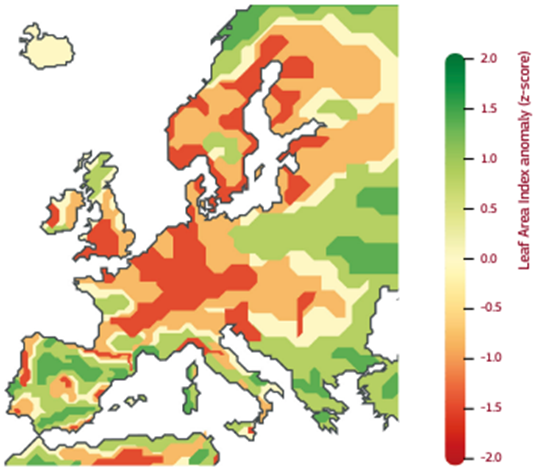
Figure 3: Leaf Area Index anomalies for August 2018 as estimated from satellites. Data source: VGT/PROBA-V (PROBA-V_2018 anomaly given a climatology from VGT) Credit: C3S/VITD
References:
1. Ceccherini, G., et al., Abrupt increase in harvested forest area over Europe after 2015. Nature, 2020. 583(7814): p. 72-77
2. Roberge, C. Inventory strategies for monitoring and evaluation of forest damage. 2017.
3. Wulff, S. Monitoring Forest Damage: Methods and Development in Sweden. 2012.
4. Nabuurs, G., Lindner, M., Verkerk, P. et al. First signs of carbon sink saturation in European forest biomass. Nature Clim Change 3, 792–796 (2013). https://doi.org/10.1038/nclimate1853
5. Taeroe, A., et al., Do forests best mitigate CO2 emissions to the atmosphere by setting them aside for maximization of carbon storage or by management for fossil fuel substitution? Journal of Environmental Management, 2017. 197: p. 117-129.
6. Nature 583, 8 (2020). https://doi.org/10.1038/d41586-020-01848-x